
Comparing 30-Year & 15-Year Mortgages
Share This
Please share this, either by using the social button on the top right of the page, or by using the below embed code
Share This
Please share this, either by using the social button on the top right of the page, or by using the following embed codes
Sources & Resources
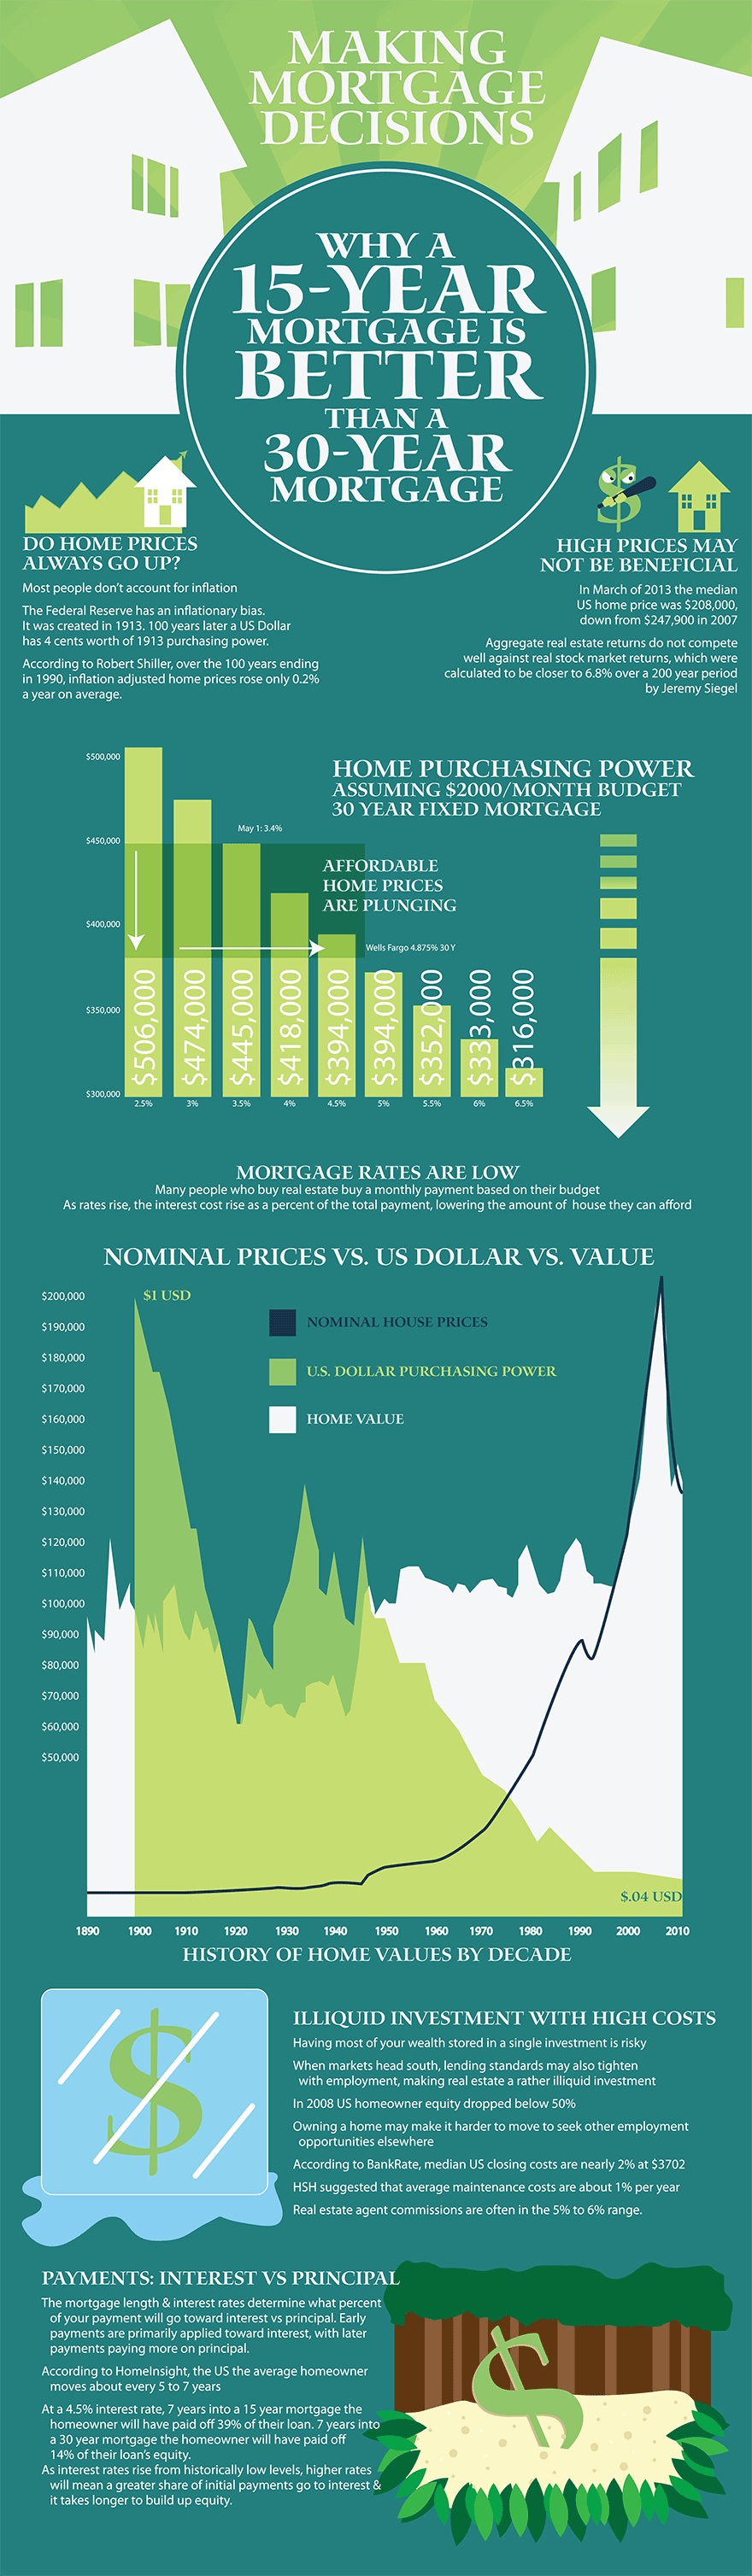
- Inflation & Returns
- BLS: the value of a 2013 Dollar in 1913
- According to Robert Shiller, over the 100 years ending in 1990, inflation adjusted home prices rose only 0.2% on average.
- Jeremy Siegel calculated stock market returns to be closer to 6.8% over a 200 year period.
- Transaction Related Expenses
- The cost of maintaining & selling a home: HSH suggested maintanence costs about 1% a year, BankRate suggested median closing costs are nearly 2% at $2,402 & real estate commissions are often in the 5% to 6% range.
- FRB of St. Louis: A Note on the Effect of Transactions Costs on Real Estate Investment Return
- Equity, Prices & Moving
- Compare how quickly you build equity with a shorter loan term by using this free mortgage term comparison calculator
- US median housing prices via Census.gov & Ycharts
- In 2008 US homeowner equity dropped below 50%.
- HomeInsight stated that in the US the average homeowner moves about every 5 to 7 years, though home owners stayed in place longer after the 2008/2009 housing crash.
- Homeownership & Happiness
- NYT: Homeownership, the Key to Happiness?
- Michael Hudson on the new road to serfdom